
Meteorología Valle de Mena
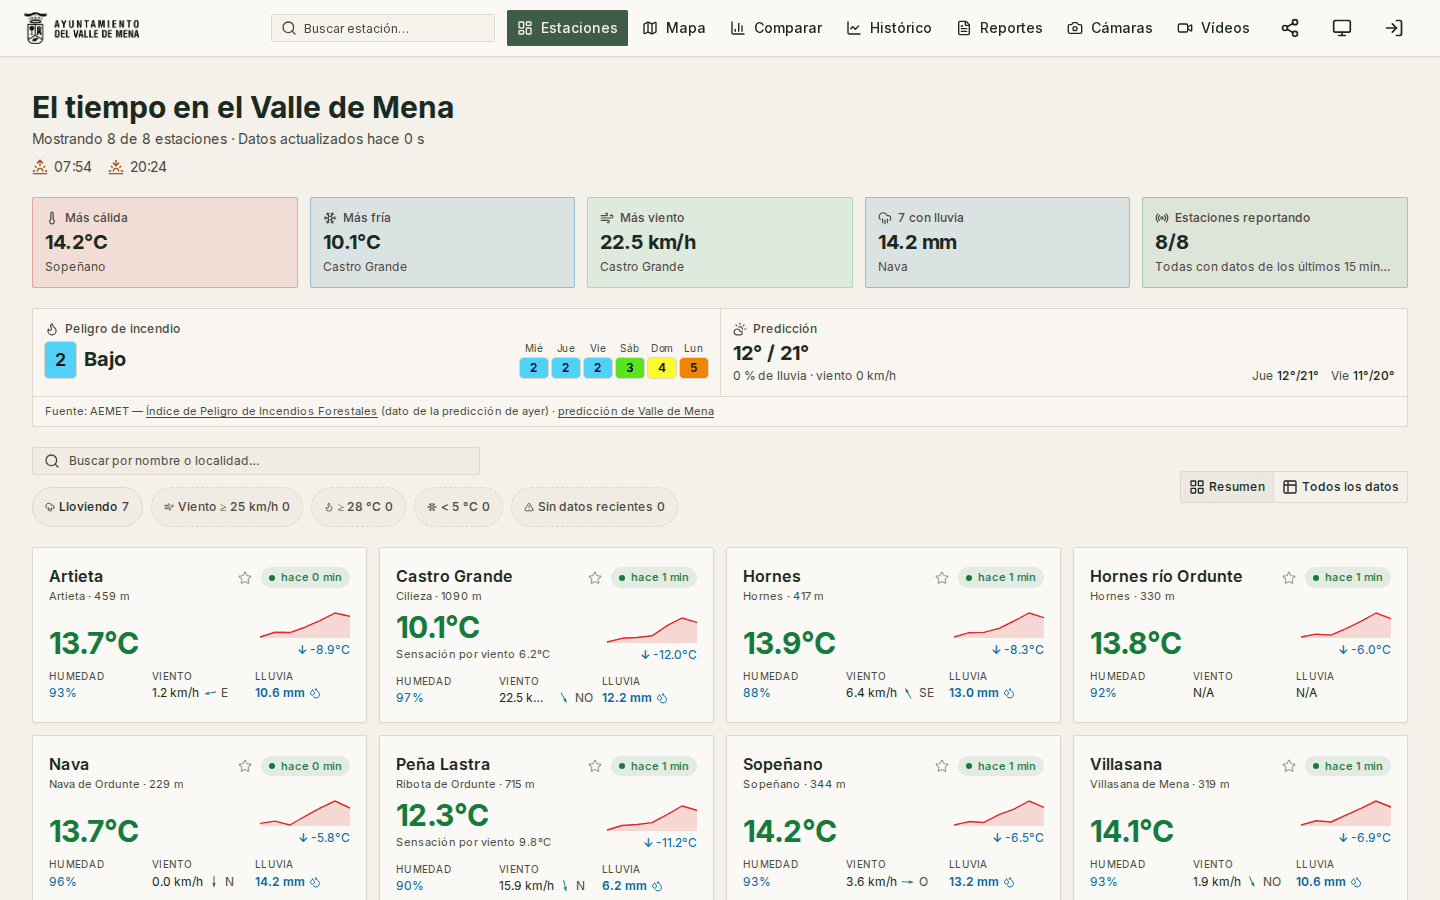
The public dashboard of the Valle de Mena weather station network (Burgos, Spain): anyone can come in and see, minute by minute, what the weather is doing in each village of the valley, with a map, live cameras and sky timelapses.
Beyond the weather right now, the site is the climate archive of the region: daily, monthly and yearly history per station, records and exportable annual reports.
Features
The full network live: temperature, rain, wind, humidity and pressure per station, with trend sparklines and favourites.
Interactive map with every station geolocated and its live data.
Station comparator showing how the last 24 hours evolved.
Per-station page: daily extremes, wind rose, records, agroclimatic panel (degree-days, frost, evapotranspiration) and barometric forecast.
History explorer with four modes, calendar heat map, year-on-year analysis and CSV and PNG export — with series going back to the early 2000s.
Annual climate reports per station, printable and marked up as a Dataset for Google.
Live cameras plus a gallery of timelapses and "Best Moments" by year.
Private control tower: station health, automated jobs with logs, per-variable quality filters and camera and video management.
Early smoke detection over the camera frames: three models score each image and the application decides what counts as an episode, though only one of them raises the alert; at night it does not evaluate, because all that stands out is the village lights.
Alerts by email and Telegram to whoever subscribes, and a separate panel for council staff — with its own permission and no access to the rest of the site — where each episode is judged.
A public page for every confirmed fire, and a map of the official Castilla y León fires, always cited to their source, with the level and the means deployed.
Technologies used
Auditable data pipeline
Idempotent daily aggregation with automatic retry of incomplete days; every pass is recorded with status, duration and log, and can be relaunched from the panel.
Data quality with traceability
Plausible ranges configurable per variable and station; every discarded reading is stored and counted, so it is always possible to explain why a value is missing.
Live + history + archive in a single interface
Current API series, the modern history and data imported from stations decommissioned years ago all coexist under the same filters.
A model has suspicions; publishing suspicions of fire is not informing
The detector only scores frames: the application decides what an episode is and a person delivers the verdict. Only what is confirmed as fire reaches the public, written in the past tense and carrying the emergency number; the in-the-moment alert goes by email and Telegram to those who asked for it.
Fire danger modulates, it never filters
AEMET’s danger index only changes how many consecutive frames are needed to confirm an episode, never whether to alert: most wildfires are human-caused and happen on low-danger days.
A proven foundation for projects like…
- Town councils and regional authorities that want to publish their station network and climate archive.
- Ski resorts, mountain huts and climbing clubs: minute-by-minute data by altitude, wind and sky cameras.
- Wineries, estates and irrigation communities: the agro panel already computes degree-days, frost and evapotranspiration.
- Town councils with woodland around them who want the landscape cameras to detect smoke as well.
No fixed rates: every project is quoted on its real scope.